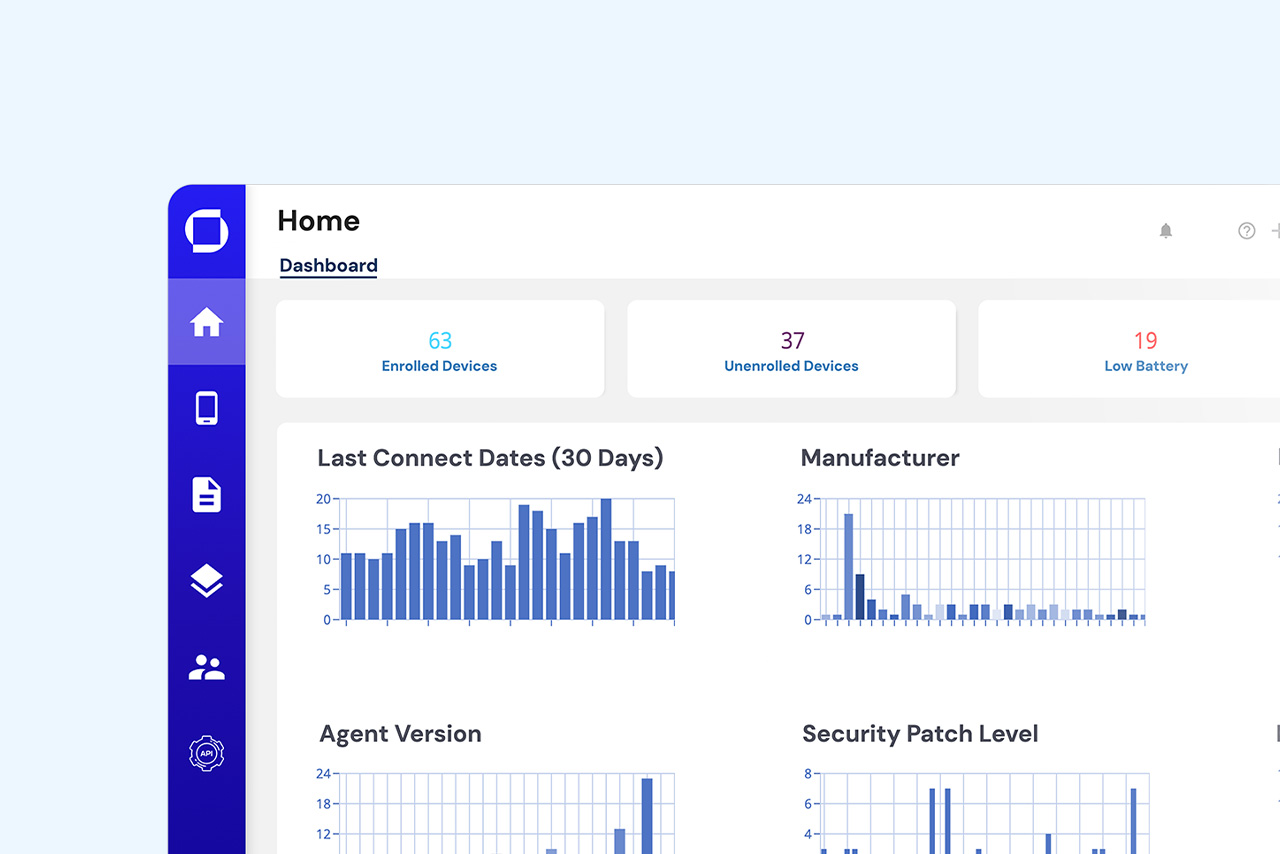
Springmatic has an intuitive UI that is built to scale to 100,000+ devices seamlessly. Its built-in dashboard and powerful filters help managers tease out a lot of detailed information about their device status, apps running, and more. However, for users looking to take their information and further customize how it is presented, the platform can be paired with other data analytics platforms as well.
This blog post will look at getting a basic dashboard up and running using the popular open source tool Grafana as an example.
About Grafana
Grafana OSS is an open source tool for querying, visualizing, and exploring data sets from a wide range of data sources. The tool has many functions from dashboard creation, to alerts and more. There is also enterprise and cloud hosted instances that organizations can explore for better support and greater uptime. You can find more information about the project here: https://grafana.com/docs/grafana/latest/introduction/ .
For the purposes of this blog we will focus on the dashboard creation and pair it with the Springmatic platform.
Getting started - Generate an API key
In the Springmatic platform there is an API tool for users and admins to import data about their devices. The icon on the sidebar is marked as BETA, not because the feature isn’t ready, but we’re constantly adding new features for the API to perform - additional information is available in the knowledge base. https://learn.springdel.com/knowledge/using-device-apis
To get started, click on the API icon in the sidebar . If the API key has never been used before, a message will say “Device API not activated”. Click ‘Activate Now’ to activate and obtain the unique API key.


Copy the key to a safe location. By default the Springmatic platform allows for 10,000 API calls to be made per month. Organizations requiring more can contact sales@springdel.com .
Once created, the API is ready to use. The endpoint for the API request is https://edge.springdel.com/api/device/. Test the API functionality by using the below command to get information about all devices in the tenant.
curl https://edge.springdel.com/api/device/ --header “X-API-KEY: <your key>”
Note curl is available by default in most Linux or MacOS devices, Windows users should also be able to use curl in Powershell.
The output should return a JSON of all the devices in the tenant. Specific devices can also be called by entering the device ID after the end of the endpoint link. For example:
curl https://edge.springdel.com/api/device/<device ID> --header “X-API-KEY: <your key>”
You can check the unique device IDs by downloading the device ID CSV file in the API section of the platform.
Setting Up Grafana
Grafana has a few ways to install and set up. In our testing, we used the Docker instance running the open source version (Grafana OSS), but users are welcome to use the Grafana Enterprise or cloud-hosted alternatives.
There is detailed documentation on getting up and running with the Docker container here https://grafana.com/docs/grafana/latest/setup-grafana/installation/docker/
TLDR - If you have Docker running on your system, just run the below command:
docker run -d -p 3000:3000 --name=GrafanaTest grafana/grafana-oss
Once that installs and is running (use ‘docker ps’ in the command line or the Docker desktop app for Windows or MacOS to check), log in on your workstation by going to the web browser and entering http://localhost:3000. Use the Grafana cloud link if you are using that instead of a native instance.

The default login for Grafana is user: admin, password: admin. Users will be prompted to change the default password immediately upon first login.
Connecting Springmatic to Grafana
Once logged in and running, we can now connect Springmatic with Grafana. Click on the hamburger menu in the upper left and navigate to ‘Connections’.

We want to add a new JSON API connection, just type JSON API in the search bar. Click on the icon to view more details.

In the connection type details click install in the upper right-hand side. Once installed, we can add a data source to connect Springmatic to the Grafana instance.

Click ‘Add new data source’ and give it a name, enter the same endpoint we tested previously. Enter a timeout, and create a custom header just like we used in the cURL command previously. The header should be ‘X-API-KEY’ and the value should be the unique API key created in the Springmatic platform.

Hint: Springmatic device check-in delay is usually 1~2 hours, so setting a 60 second timeout may be too aggressive for most use cases. Recommend around 1 hour (3600 seconds) intervals to better use the API calls.
Click ‘Save & test’ at the bottom of the page to verify the connection is working.
Building a Dashboard
Grafana is a very powerful tool with a huge amount of customization possibilities. For the purpose of this post, we’ll touch on the basics of getting started.
Go to Connections - Data sources. The newly created JSON API data source should be there.

Click ‘Build a dashboard’ to get started.
Dashboards have panels which can be used to display data based on a single query or multiple queries. The syntax for a query is $.[<what device>].<what value>. For example, to get all the values for the battery levels of all the devices use $.[*].battery_level.
Grafana will prompt with some of the values available from the data source.

The design of the view can also be selected in the upper right side of the panel editor. Choose a pie chart for an example.

In the query field enter the battery level query $.[*].battery_level. On the right side, adjust the options as desired for the panel design. The below example has the name of the panel set to Battery Level, pie chart design, Value options set to ‘All Values’, Numeric Fields, Tool tip set to ‘Single’, and Value mappings of green = 50-100, orange = 25-49, red = 0-24. The design of the pie chart can also be set as a pie or a donut.

Once set to the desired design click ‘Apply’ in the upper right-hand side.
More panels can be added to display tables, device locations, and more.

Springmatic’s API for devices is fully functional and ready for use. This allows organizations even more ways to access device data and present it in custom ways. If your organization has a need for additional functionality or interest in leveraging the power of the Springdel platform with your organization's own systems, let us know. The whole team is ready to support innovative integration and work flows.